In April of this year, Kiplinger put together an article on 3 sample portfolio with 25 of its most favorable mutual funds. At the article publication time, the aggressive portfolio lost 6.5%, the moderate mix lost 7.0%, and the conservative model returned 0.8% over the past 12 months. Since we had such a great market in the last 6 months, it makes sense to run through the numbers and see how its recommended portfolios have performed.
Aggressive Portfolio
Aggressive portfolio is targeted for people with a long term horizon over 11+ years. This portfolio holds 85% in stock funds, with one bond fund.
- Dodge & Cox Stock Fund (DODGX): 20%
- Primecap Odyssey Growth Fund (POGRX): 20%
- TIAA-CREF Core Impact Bond Fund(TSBRX): 15%
- Parnassus Mid Cap Fund (PARMX): 15%
- Fidelity International Growth Fund (FIGFX): 10%
- Wasatch Small Cap Value Fund (WMCVX): 10%
- T. Rowe Price QM U.S. Small-Cap Growth Equity Fund (PRDSX): 10%
Moderate Portfolio
Moderate portfolio is targeted for people with a 6 – 10 year investment horizon, such as building up a tuition fund. This portfolio holds 70% in stock funds, and 30% in bond funds. The article says it allocate 35% to bond funds, but the detail numbers do not add up.
- Vanguard Equity-Income Fund (VEIPX ): 20%
- Fidelity International Growth Fund (FIGFX): 15%
- Primecap Odyssey Growth Fund (POGRX ): 15%
- T. Rowe Price Small-Cap Value Fund (PRSVX): 10%
- Vanguard Wellington Fund (VWELX): 10%
- DoubleLine Total Return Bond Fund (FMIJX): 15%
- TIAA-CREF Core Impact Bond Fund (TSBRX): 15%
Conservative Portfolio
Conservative portfolio is for investment timeframe less than 5 years. It holds 70% of assets in bonds and 30% in stocks.
- DoubleLine Total Return Bond Fund (DLTNX): 25%
- Fidelity Strategic Income Fund (FSICX): 20%
- T. Rowe Price Dividend Growth Fund (PRDGX): 15%
- Vanguard Equity-Income Fund (VEIPX): 15%
- Vanguard Short-Term Investment Grade (VFSTX) Fund: 15%
- Fidelity New Markets Income Fund (FNMIX): 5%
- Vanguard High Yield Corporate Fund (VWEHX): 5%
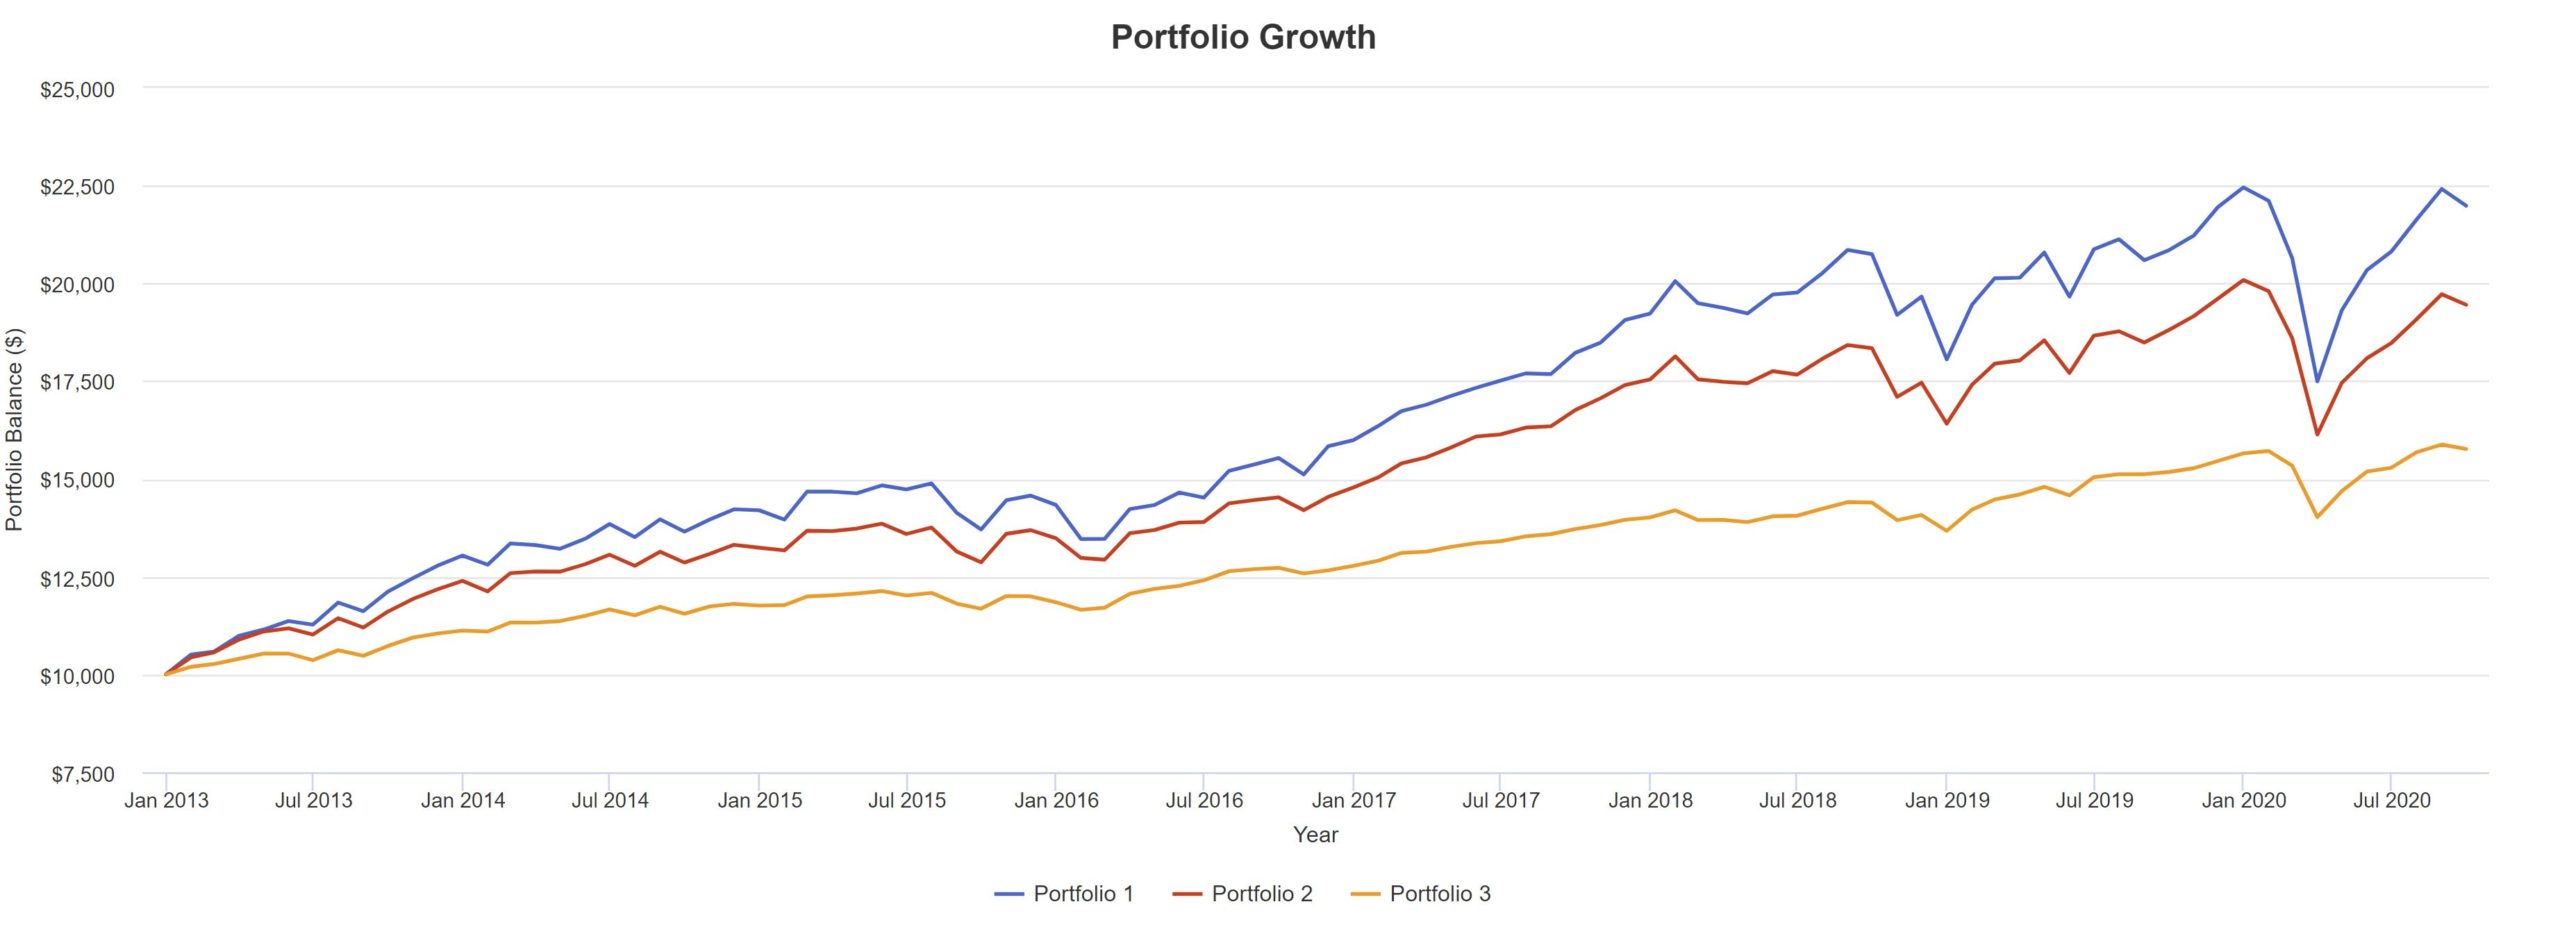
When we run these portfolios through Portfolio Visualizer, the output is quiet inline with expectation. We are able to run through the data from 2013 to now.
| CAGR | Best Year | Worst Year | Sortino | |
| Aggressive | 10.70% | 30.38% | -6.08% | 1.19 |
| Moderate | 8.97% | 23.93% | -6.45% | 1.15 |
| Conservative | 6.05% | 14.50% | -2.46% | 1.30 |
It is interesting that Moderate Portfolio can’t beat Aggressive Portfolio on the upside, but somehow lost more on the downside. This is reflected in the Sortino score. Below is the graph itself.